


Nagoya City Biodiversity Potential Map
In fiscal year 2023, we conducted a demonstration project to create a biodiversity potential map for Nagoya City. The project title was: “Demonstration to Evaluate Biodiversity Potential and Support Biotope Creation. How Should Biotopes Be Created? Visualizing Biotope Richness and Formation Processes Through Technology!”
This project created the “Nagoya Biodiversity Potential Map” by combining various topographical data (GIS) such as land moisture levels, green coverage, and land use history, with results from soil microbial DNA analysis and insights from biological experts. This map enables the prediction of areas suitable for creating biotopes.
This map offers significantly higher resolution compared to conventional maps. Consequently, it enables pinpoint identification of suitable habitats, or hotspots. The project also verified the map's utility by establishing small-scale biotopes in predicted hotspots.
Using this map allows for the estimation of suitable locations for biotope creation. It also facilitates the easy estimation of areas that should be conserved from a biodiversity perspective.
The report is also featured on the Hatch Technology NAGOYA website (→here).
Although the demonstration project has concluded, we have created a new potential map for Nagoya City based on it, which we introduce below.
Nagoya City Potential Map
Ecological Network Map
The locations of “green spaces” such as parks and Satoyama across Nagoya City are visualized in green on the map.
The movement of wildlife between green spaces is indicated by connecting them with orange lines. *This map shows the connectivity between green spaces accessible to butterflies, assuming a butterfly movement distance of 400m.
●The varying shades of green indicate how well connected this area is to surrounding green spaces within the network and its importance as a central hub.

A
B
Zooming in...
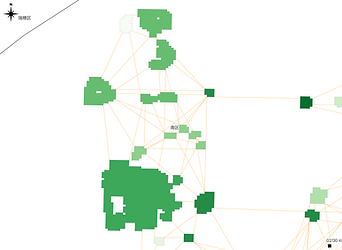


Orange lines: Butterfly movement
Dark green: Very important green space!
A
B
Medium green: Moderately important green space!
Light green: Less important green space!
Green spaces are sparse in the city center. More green spaces are concentrated in the eastern part.
The riverbanks of the Shonai River surrounding Nagoya City are important green spaces.

Potential Wetland Habitat Map

around “Idaka Green Space”
Nagoya City green spaces are shown in light green.
Water retention potential is indicated by a blue gradient. Darker blue areas indicate land more prone to water accumulation.
Areas where blue and light green overlap indicate “high moisture levels with vegetation present.”
Such environments are highly likely to support frogs and aquatic insects.

Water Habitat Potential Map (Enlarged)

pond
Zooming in on the area around “Idaka Green Space” in Meito Ward on the map above...
We can see that moisture levels are high around the pond, and there are moist areas under trees—moist areas that are difficult to identify from aerial photos.
